There are plenty of ways to improve user experience on your web page, but tuning-up the page loading speed is one of the most important.
Here we check out the tools, techniques and best practices you can use to test a website’s speed – and what to do with your results.
- Why site speed is so important
- Website speed testing methods
- Site speed testing best practices
- Google’s tools
- Other speed-testing tools
- Common mistakes
- Site speed testing jargon explained
- Frequently-asked questions
- What to do with your results
Read on to learn more from our ultimate guide to page speed testing.
Why website speed is so important
Everyone wants a website that’s quick to load, but why is this exactly? What makes site speed so important?
Google’s Core Web Vitals
Google has recently introduced its Core Web Vitals (CWV) — a series of metrics designed to measure the performance of a web page.
While Google has been measuring page speed and using this as a ranking factor for some time, the introduction of CWV has pushed this to the fore.
It seems that website speed is more important than ever for any business seeking to get noticed online.
- Largest Contentful Paint (LCP) is one such metric. This measures the length of time it takes to load the largest file
- First Input Delay (FID) is another, analysing how long it takes for the website to become interactive
- Cumulative Layout Shift (CLS) refers to the stability of the page. The page is made more stable by reducing the number of layout shifts during loading
They’re also set to introduce other measures to CWV soon, covering animation and interaction speeds.
Diverse access
Your users are accessing your website in lots of different ways. For example, while mobile internet usage is growing, it still represents only 56.89% of global internet access.
Users are still relying on desktop computers, laptop computers, tablets and other devices to reach with your content just under half of the time.
What’s more, they’re using different browsers and operating systems as they browse this content.
In other words, your website needs to run swiftly and efficiently, no matter the access type, improving the experience you offer to your customers.
An international approach
Your users aren’t just coming to you on different devices and operating systems. As your business grows, you’ll interact with leads, customers and partners from right across the world.
During this process of growth, you need to be aware of these international users and how you’re supporting them.
Not all countries and regions enjoy the same quality of internet connection — for example, while South Korea and the UAE enjoy mobile connection speeds of over 200 Mbps, Guinea-Bissau and Ethiopia experience only 1.2 Mbps connections on average.
A content-heavy website needs to be tested at different internet speeds to ensure easy access from around the globe.
By catering to various connection qualities, you’re supporting a more global outlook for your business.
Conversion and retention
Customers quickly get frustrated by websites that are slow to load. Don’t forget, they have plenty of choice elsewhere in the market, and research from Akamai suggested that 79% of online shoppers say they will stay away from an online store if page performance is poor.
The slower the page loading time, the higher the bounce rate, increasing by 32% between one and three seconds and by 90% between one and five seconds.
To achieve the best levels of conversion, you need to be providing a streamlined user experience — something that will come with great loading times.
Ongoing sustainability
Unfortunately, websites contribute to carbon emissions. If your site takes a long time to load — due to lots of large files and images, for example — this is adding to your business’s carbon footprint and is reducing your long-term sustainability.
By testing your website’s speed and then improving this speed, you’re helping to ease your impact on the environment.
Website speed testing methods
There are the most popular approaches you can take to test the speed of your website.
Waterfall analysis
Waterfall analysis offers a visual map of your page and its assets (files and code), outlining how well each is affecting the loading speed.
With this method, you can track the performance of CSS, JavaScript and HTML coding, as well as pre-coded assets such as images and videos, plugins and app integrations, and third-party content.
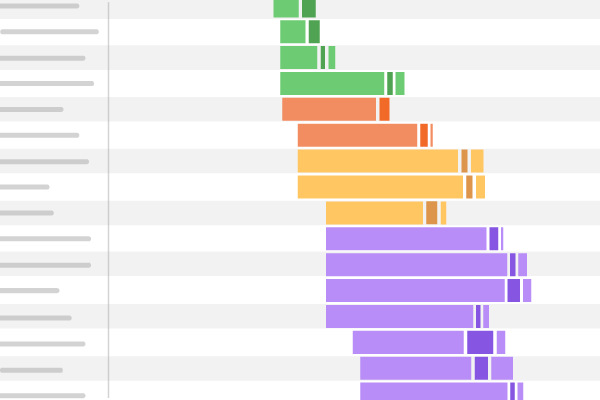
With the handy waterfall chart, you’ll be able to see at a glance how quickly each asset appears in the user’s browser.
From this, you can manage the loading order — something that may have an impact on the overall performance of the page.
Scoring
Another way to present results is scoring: commonly on a 1-100 scale. Scoring uses tools to analyse the performance of your webpage as a whole and assign it a value.
You can then use this value as a base level and make tweaks and adjustments to improve your score.

The best kind of scoring will provide more detail, identifying elements that are performing well and those that are underperforming. This gives you more insight that you can put into action.
Website speed testing best practices
Before we get into the different tools you can use to test your website speed, let’s take a look at some rules you can apply to your own testing procedures.
Multiple runs
There are many different factors that affect page loading time. These range from the time of day, the device being used, right up to the number of other users currently accessing a particular resource.
With this in mind, you’ll need to conduct multiple runs to get a clearer picture of website speed and performance from testing.
Try to cover as many of these different variables as possible — conduct device-specific tests or check your page speeds at times of low and high user volumes to gain maximum insight.
Caching
When your users visit your site for the first time, their device is a ‘clean slate’ and will have no prior information about your pages.
After this first contact, your relevant content, site info and user preferences will be stored as a cache.
This means that when the user returns to your site for a second time, this information will be easier to access, and page loading will be much faster.
Be sure to test both the cached and non-cached versions of your site to understand how performance can be improved.
You can also adjust your caching protocols to give a better experience to returning customers.
Your testing toolkit
You certainly don’t need to go it alone when testing website speed. While it’s true that putting yourself in your customers’ shoes and using the website with their point of view in mind does provide some value, you still need a well-developed toolkit to get the most from testing.
The next two sections cover the apps that can become part of a well-developed testing toolkit.
Google’s website load time testing tools
Page loading times are taken into account when it comes to search engine rankings, so it makes sense to incorporate some of Google’s own tools into your testing process.
Chrome Dev Tools

- Chrome Dev Tools is a set of free tools, including tools to test your website speed, in Google’s Chrome browser interface. Similar tools are found in Firefox and Safari.
- The toolset is relatively easy to use, but the amount of info it provides may be a little overwhelming for beginners.
- Access the tools using Ctrl+Shift+I or F12 on Microsoft or Linux OS, or using Option+Command+I on Apple Mac OS, then select the Network tab.
- After you have made a recording of the page speed and performance, the Network tab displays a series of performance values broken down by page element. This includes the size of the element and the time taken for it to be delivered. To make a new recording, hit the record button on the top left of the DevTools window or press Ctrl and E
- The Network tab also provides information on the MIME resource type, the HTTP method (either GET or POST), the referrer that sends the request to the server, and other data values
- The Network tab provides a waterfall view in the rightmost column of the report, examining the order in which page elements are loaded
- This waterfall view offers further information, including the time taken in blocking, sending, waiting and receiving. These insights may be too high level for non-technical users. Don’t worry: we have simpler tools coming!
- Wait times may be skewed if the server sends content while it’s still being generated — for instance, in the case of PHP scripts sending HTML code
- Performance values are further broken down into total page loading times and DOMContentLoaded. The latter tells you how quickly users can start interacting with the page.
- There is no scoring in the website performance report delivered by Chrome Dev Tools, which can make it difficult for beginner users to navigate the results, and there are no actionable recommendations
- You can export your report by right clicking at the top of the screen, or using the ‘down’ arrow. You can upload saved profiles in the same way.
PageSpeed Insights

- PageSpeed Insights is the main Google website speed test tool, offering website performance monitoring for free
- It’s easy to use and designed for beginner and advanced testing jobs
- Google has said that PageSpeed Insights provides a performance overview rather than a direct page load speed test that affect will search position. Although it’s likely that improving a low PSI score will help to improve it. See our FAQs for more about this.
- It provides results that includes Google’s Core Web Vitals
- PageSpeed Insights derives data from the Chrome User Experience (CrUX) tool and from the Google Lighthouse API
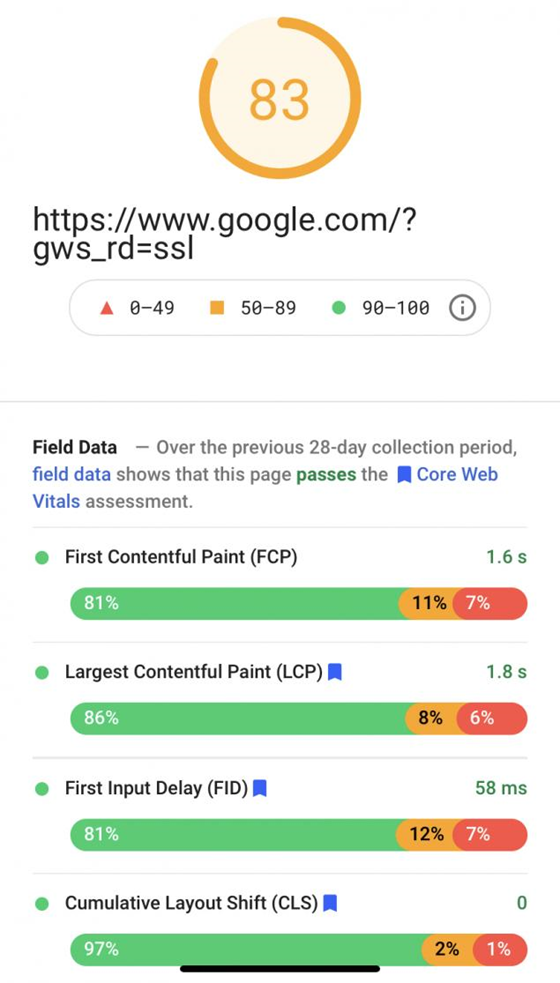
- To test a page, input the URL and hit Analyze, then take a look at a breakdown of performance factors. These are divided into Field Data (RUM) values.
- You will also receive an overall score – from 1 to 100
- Colour coding make it easy to derive insight at a basic level, along with concrete data values
- PageSpeed Insights provides opportunities and diagnostics that serve as recommendations to improve performance
Lighthouse

- Lighthouse is a free website performance and speed test tool from Google
- It’s probably easiest to use as a Chrome extension, but it can also be run from Dev Tools, the command line or as a Node module. If you’d prefer not do it this way, see Measure below
- It’s a synthetic monitor: insights are based on the tests it does at the time, not real user data from the last 28 days, unlike PageSpeed Insights
- Reports are broken down into five key categories, covering performance, accessibility, best practices, SEO and progressive web apps
- Each category is scored on a 1-100 scale, making it easy to understand where improvements can be made
- Like PageSpeed Insights, Lighthouse provides recommendations and diagnostics for each category, giving you an indication of how you can improve the score
- The tool also covers Google’s Core Web Vitals
- Lighthouse is aimed at supporting a better experience for all of Google’s users, so it deploys simulated throttled connections. The current default is an emulated Moto G4 from 2016: a fairly ‘low power’ phone by today’s standards. So it’s very much a ‘worse case scenario’. Most users won’t be experiencing the delays it describes: however, it’s important that your website is accessible to all.
Search Console and Analytics
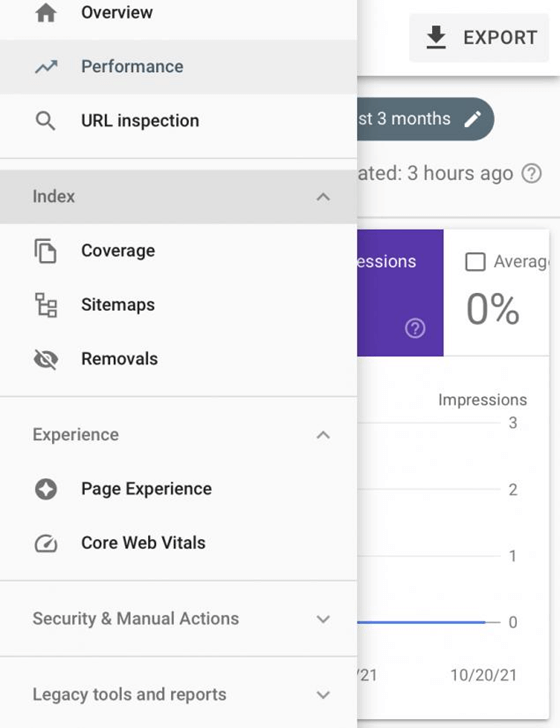
- Search Console offers page speed metrics that have been recorded by Google
- It’s is easy to use, with the reports providing actionable recommendations on how to improve the site’s performance.
- Performance scores are rated as Poor, Needs Improvement and Good, providing immediate, ‘at a glance’ insight
- The tool organises its results into URL groups with aggregate scores so you can see ‘top level’ data
- You can drill-down to more detailed info by clicking on each URL group and examining the individual URL data
- Using the Core Web Vitals report enables you to directly target these Google page performance factors
- Like PageSpeed Insights, Search Console uses data from the CrUX report
- The tool gives you the opportunity to monitor pages for ongoing speed issues, and to implement 28-day post-fix monitoring to ensure changes have been successful
- It’s designed as an effective site-wide bulk monitoring and analytic tool, compared to other website performance tools like PageSpeed Insights, which may be more useful for individual page analysis
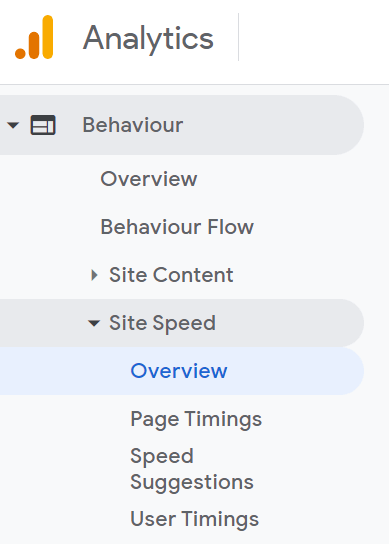
- While Search Console gives speed data that was recorded most recently, Google Analytics gives you the opportunity to look at page speed over time
- This historical data will again be field data (RUM), recorded by Google, so it’s useful to see how changes you make might affect loading times
- While it has a ‘Speed Suggestions’ section, it’s very bare-boned and not the most useful, compared to most other tools
- It can also give you ‘average user timings’ over time, which again can be useful to gain knowledge about your users, and how well they’re interacting with your site. However, this does need to be set up using Analytics.js.
Other web page speed-testing tools
Of course, there are many other tools outside of those provided by Google.
Some of these tools integrate some of Google’s features, providing additional insights. Here are a few of the other options at your disposal.

GTmetrix
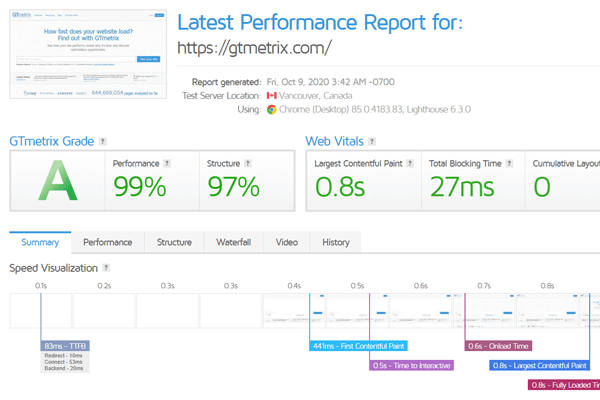
- GTmetrix is a freemium website performance test tool
- Some features are available only on the pro version, including mobile performance testing, global monitoring and API access
- It’s easy to use for beginners, but with enough advanced features to support experienced users
- GTmetrix a user-friendly experience, and includes handy graphs and videos of page loads — which can be watched in slow motion
- Scheduled testing gives you detail on page performance changes over time
- There are plenty of different configurations and variables to try out, including different countries and jurisdictions, connection speeds, browser and OS types
- There are seven free testing locations: Australia, Brazil, Canada, China, India, UK and the USA. Testing from their 15 other locations requires a premium subscription.
- There are a number of simulated device options to test your page performance on different user access devices
- Alerts are delivered automatically when page metrics exceed pre-defined levels

Pingdom
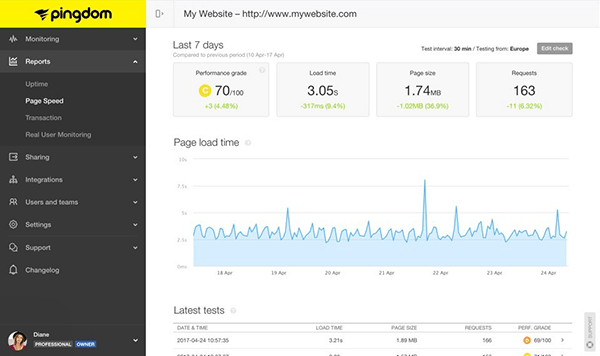
- Another freemium product, Pingdom offers free demos and a free trial as well as some basic testing features outside of the subscription
- They offer 44 different pricing tiers (!), based on the number of checks you want to carry out, and whether you want RUM data/synthetic data or both
- It lacks the broader free functionality provided by GTMetrix, but you can run a basic free test here
- It has a steeper learning curve than GTMetrix, geared more towards intermediate to advanced users
- It’s extremely versatile, offering an advanced synthetic monitoring environment, simulating a range of different actions, from new user registrations to shopping cart checkouts
- Uptime monitoring is included across more than 100 simulated locations
- Insights derived from synthetic and real user monitoring can be viewed and compared together in Pingdom’s user interface
- Real user insights are delivered in real time and monitored on an ongoing basis, giving you the foundational understanding you need to assess website performance as it develops
- You can set KPIs and SLAs, then monitor these targets
- User reviews suggest Pingdom’s website speed test is highly effective at scale, with some users tracking hundreds of different sites, services tools and apps via the solution
- Pingdom provides its own API, as well as implementation support, to help users achieve integration within existing systems and portals
WebPageTest

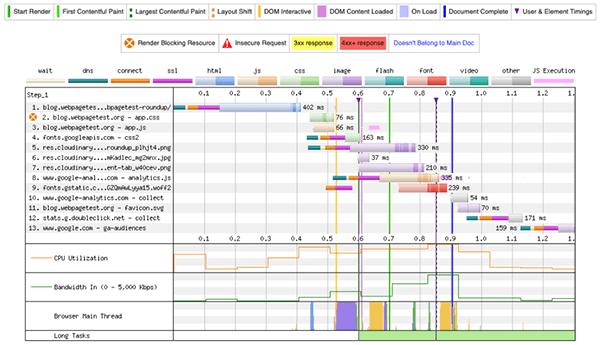
- WebPageTest is a free webpage speed testing tool, most well known for its ‘waterfall’ design
- While it is designed to be very easy to use and suitable for beginners, it also offers advanced features
- It has an intuitive user interface that puts a range of testing capabilities in the hands of the user. This includes Core Web Vitals, simple and advanced testing breakdowns, visual comparisons and graphs.
- It enables advanced configurations for additional insight, including testing multiple runs and connection types
- The tool uses video capture features to analyse the user experience and offer supporting technical metrics
- WebPageTest claims to provide highly accurate simulated testing conditions reflecting the real experience of users, covering many locations across the globe, as well as different browser versions and devices
- It was developed by AOL team members in 2008 for use on the company’s web properties, and it has been used by high-profile websites since then
- It recently became part of the Catchpoint digital experience monitoring platform, which powers WebPageTest’s real-world and synthetic monitoring capabilities (we used to provide a server for them, but they no longer need it)
- The WebPageTest API enables integration with existing systems and workflows and is designed with developers in mind
- The website performance monitoring tool is open-source and available for developers, provided they are not making competing products
Uptrends

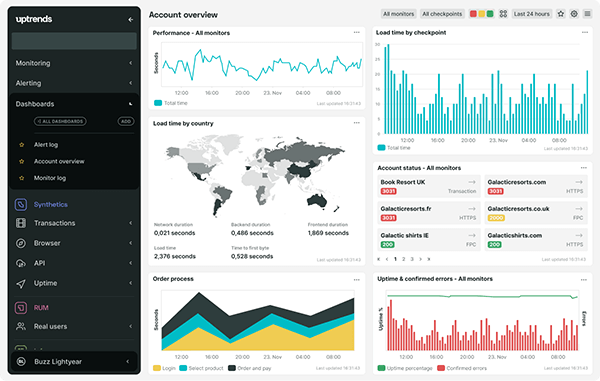
- Like Pingdom, Uptrends offers a website speed testing tool among a wider suite of solutions. The tool is available for a 30-day free trial, with a premium subscription required beyond this.
- A limited free tool is also available to test your website speed, without some of the more advanced features offered on the premium version
- The tool features an intuitive interface that makes it suitable for beginner users, right up to more advanced development-focused users
- It offers comprehensive results that cover the Google PageSpeed Insights score as well as other page metrics. Recommended improvements are also provided.
- Results are displayed via the scoring methodology, as well as via a page-load progression report in the waterfall format
- Users can configure the browser they want to speed test for, across Chrome, Firefox, Internet Explorer and Phantom JS. The tool stays up to date with the latest browser versions and can simulate throttling to test different connection speeds.
- 10 simulated testing locations are available on the free version of the Uptrends speed test tool. This is extended to 228 locations for the premium version.
- The tool is designed for collaborative use, making it easy for remote teams to work from the same datasets with the Share Results button.
- With automation, users can schedule website speed tests and can even implement round-the-clock testing at five-minute intervals if required.
- It integrates with other Uptrends tools to provide comprehensive testing and monitoring across websites, applications, APIs, servers and other properties.
Bytecheck

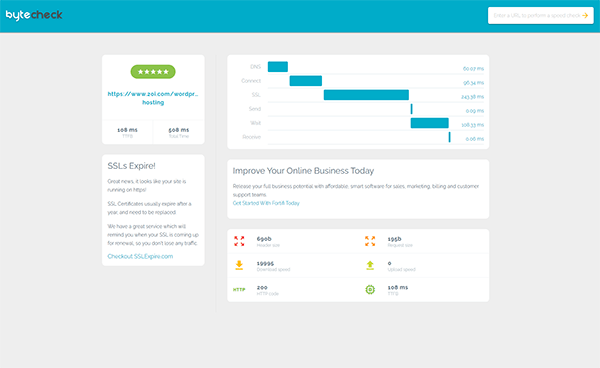
- Bytecheck is a free tool for those a very quick and simple overview of website loading speed
- The tool is very basic, so it would be good for beginners. It lacks some of the more advanced functionality of other tools, though.
- The main focus for analysis is Time to First Byte or TTFB. So it’s useful for checking the speed of your web hosting! The tool also displays values for total loading time and SSL certificate status.
- Itemised breakdowns of component loading times are provided in a simplified waterfall format, demonstrating the loading order of the page
- Bytecheck also provides a table with information on header size, request size, download speed, upload speed and HTTP code.
- It doesn’t provide tips on how to improve the performance of the page, but it does offer premium third-party services to achieve these improvements
- At the top of the speed test results screen, Bytecheck provides an overall performance score in the form of a star rating from one to five
- You’ll find it to be a slimline solution that doesn’t go in to much detail. However, Bytecheck’s free service is quick and easy to use.
k6 (formerly known as LoadImpact)

- k6 is a bit different: it specifically tests server speeds and responses when a website is under load: it simulates what would happen if lots visitors came to your site at once
- So it’s not specifically about the speed of loading a web page, rather how your site would deal with unexpected demand. I’m including it here as an example of other types of ‘speed testing’.
- It won’t give the same kind of optimisation tips that you get with more website SEO-focused apps, but it can highlight errors or delays in your site which may have gone unnoticed
- Users can access a free load test trial of 50 cloud tests, but a subscription is required beyond that.
- K6.io is aimed developers, so will require some scripting knowledge
- Users have a lot of configuration capability, and they can write specific tests using JavaScript to simulate real-world connections and access scenarios.
- Tests can be automated to achieve ongoing insights over time
Common mistakes when website performance testing
As you approach your performance testing, there are some things you need to keep in mind.
Geographical breakdowns
Don’t assume that all of your users are having the same experience.
If you’re working with customers and clients from different locations — even within the same country — you need to be aware of variations in performance across these locations. This is why it’s important to be able to test website speed and performance from different locations.
It’s worth using a tool that enables you to simulate different geographical access points with synthetic monitoring.
Different results from different tools
It’s important to remember that different website speed tests work in different ways. For example, one tool might measure the time it takes for a request to be sent to the server and returned, providing a single result.
Another tool might repeat this test multiple times, providing an average result or posting the quickest response time in its report.
This is just one example, but it illustrates the different methods deployed by different tools.
Of course, this has a practical impact. The report you get from one tool might include different values to a report from another tool. This can be seriously confusing and frustrating for testers!
Try out a few different tools together to gain a more accurate picture of your site’s performance, or use the values you receive in your report as general benchmarks for performance improvement.

What is measured? Website speed testing jargon explained
Page speed testing can be a complex exercise, and you may even find yourself testing a number of different KPIs and metrics across different tools and receiving different results.
These categories might be labelled with acronyms — TTFB, for example — or you could encounter different labels that indicate the same thing. Understanding each of these different values, and recognising which KPIs to use when measuring website performance, is vital for speed testing.
Here’s our guide to the terminology used in speed testing: feel free to suggest any/the many we have missed!
What is TTFB (Time to First Byte)?
The time period between a browser HTTP request and the delivery of the first byte from the server. This is highly dependent on your web hosting, but many other factors come in to play.
What is SSL (Secure Socket Layer)?
Used for security, it’s a protective layer between the application layer and the transport layer, used to secure information sent across an internet connection.
More simply, it’s the source of ‘https’ connections. It encrypts information going between your browser and the website.
Its more modern version is the updated transport layer security (TLS): but people still call the certificates used to create this security ‘SSL’: the name has stuck!
What is Ping / Ping Speed?
Ping speed tests for websites look at how long it takes for the internet connection to respond to a request, usually measured in milliseconds. It’s also sometimes referred-to as ‘latency’.
What is Packet Loss?
Ping speed tests for websites look at how long it takes for the internet connection to respond to a request, usually measured in milliseconds. Also referred to as latency.
What is PDV (Packet Delay Variation)?
PDV is the variation in ping speeds over the duration of a connection. Also sometimes called jitter – a much more accessible name – this can make it difficult for the end user to interact with the website.
What is Lossy / Lossless Compression?
These are methods to reduce the file size of a page component — usually an image or video file — and accelerating loading speed. Lossy compression involves some reduction in display quality, while lossless compression retains the same level of quality. More about image optimisation.
What is RTT (Round Trip Time)?
The total time taken for a data packet to reach its destination and for an acknowledgement to be received in return.
What is RUM (Real User Monitoring) / Synthetic Monitoring?
These are different types of data used for webpage performance monitoring. RUM uses the real user experience with monitoring of users, so it’s historical.
Synthetic monitoring is machine-based, and such, is usually the ‘live’ data at that moment. It can be used to simulate different connection speeds or geographic locations.
What is Core Web Vitals: LCP (Largest Contentful Paint)?
Core Web Vitals are the latest metrics introduced by Google as part of their ‘Page Experience’ updates. LCP is the time taken to load the largest content on a page. It’s often an image or video but could also be something less obvious, like a font.
What is Core Web Vitals: FID (First Input Delay)?
FID is the delay between when the screen first loads in a browser, to when it can be interacted-with, like a click or screen tap.
What is Core Web Vitals: CLS (Cumulative Layout Shift)?
CLS measures the stability of the page by looking at layout shifts that aren’t the result of user actions. An example might be when you see some content suddenly ‘jump’ to a new position during page loading.
What is FCP (First Contentful Paint)?
The moment when the page appears to have started loading. For example, when the first text or images are rendered on-screen.
What is TTI (Time to Interactive)?
The time between FCP and when the user can interact with the page (like clicking, typing or scrolling).
What is TBT (Total Blocking Time)?
The time between when the page appears to load (FCP) and when it can interacted with (TTI), when the main thread was blocked.
This ‘block’ is when the browser is downloading a large file processing for over 50 milliseconds.
That 50ms is because for a time longer than that “it’s likely that the user will notice the delay and perceive the page as sluggish or janky” (to quote Google).
What is FCI (First CPU Idle)?
When your computer gets a rest. It’s the amount of time before the browser stops making the CPU do tasks (like JavaScript or other work).
Site speed testing: FAQs
Is the Google PageSpeed test reliable?
It’s reliable in the sense that it’s a good indication of what Google’s impression of the web page’s ‘usability’ when it comes to speed.
There are some things to bear in mind here. The PageSpeed Insights score doesn’t give you an accurate picture of your page loading time via its testing features – simply because it’s designed to reflect the whole user experience, not just speed.
For example, you could remove render-blocking JavaScript to ensure that all page elements are loaded quickly, improving the user experience and your page’s score in the process. But this may not improve the page’s loading time directly.
The score is also weighted: some metrics are given more importance than others in the final score calculation.
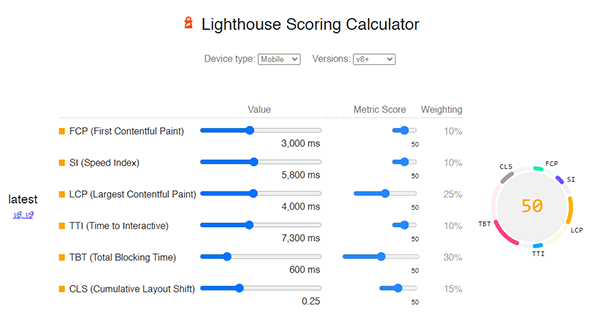
So in the example above, if you had really high Total Blocking Time, then reduced it, your score would increase a lot more than if you improved Time to Interactive or First Contentful Paint, for example.
That doesn’t mean that you shouldn’t try to improve the lower-weighted elements too, but it’s useful to know which areas to prioritise.
Don’t get too hung-up on scores
It’s easy to become over-obsessed with these abstract ‘scores’. We live in a gamified world, where almost everything is given some kind of numerical rating.
It’s understandable that we obsess over them, but as discussed, these scores are just a guide: not the final verdict on your web page’s usability.
Our advice would be to not worry too much on the final score you’re given. Look at the detailed recommendations and see what’s practical to improve.
“You can’t break down speed into one simple number — it is a bunch of factors”
Martin Splitt, Google
I know that seeing the massive list of recommendations can be overwhelming! But look for the easy-to-change stuff first. Low-hanging fruit like image optimisation is always a good place to start.
Can I check the page speed of a website hosted locally?
Yes, you can use the browser-based Lighthouse website speed test tools from Google, to check the website speed and performance of a LocalHost property.
To do this, you need to inspect the website elements, using the F12 key or pressing the Ctrl, Shift and I keys together. This will bring up the inspect window. From here, you can use the Audits tab and choose Performance to test the speed.
You’ll have the option to test the website performance and loading at different connection speeds.
The Throttling option enables you to test at these speeds, helping you to get more insight from your tests. Remember that you need to cater for users across a range of internet connection types and quality levels.
Which website is the best for testing internet speed?
It’s useful to know how fast your own internet connection is when designing and building websites, especially if you’re working from home. This can be achieved by using free web-based internet tools.
You can run these tools in your web browser and find out how your internet connection is currently performing.
There are many options out there and different users have different preferences. However, well-established options such as Speedtest.net and TestMy.net are popular choices among internet users and professionals alike.

Different tools display their results in different ways, so it is worth spending time using multiple tools to find the one that suits you best.
Which is the best free website speed testing tool?
In the words of Google’s John Mueller, “it depends”.
Why do you need to test your page’s loading speed? If you’re concerned that a Google search performance could be related to page speed, then Google’s tools – PageSpeed Insights and Lighthouse – are your friends.
Then if you need some extra detail – or a second/third opinion – we find that the free versions of GTmetrix, Pingdom and WebPageTest are some of the best website speed testing tools available.
They offer tons of information to business owners and web developers, presented in a user-friendly way, with no charge or subscription fee.
There are other tools available, and we’ve looked at some of these above. Some may test different things.
Or be better than others at presenting a particular metric.
Or you might simply find that the user interface of another is more attractive to you! It’s very subjective, so you can’t really say ‘X’ is ‘the best’.
Others are much more than ‘just’ speed testing tools. Perhaps you can consolidate your outgoings by buying-in to a suite of tools that include a speed testing module?
Different tools use different methods, and give different results. It’s ‘horses for courses’: use what suits your use case.
But also you should ‘back as many horses as you can’ (to stretch the metaphor too far!): test using a variety of tools.

When it comes to testing performance, it’s important to get as full a picture as possible. Compare and contrast different tools’ results for the same page, finding out which work best for you.
I’ve got my webpage speed test results – what next?
In this guide, we’ve focused on website speed testing only. That’s because it’s important to first establish a methodical system of testing and analysis.
With this foundation, you can begin to hone and streamline your website for all your users.
So how do you fix the problems that have been identified in testing? That’s a whole other article – or many articles!
One way in which we can help is our free Website Acceleration Suite with all shared hosting and Managed Hosting. With this, you can choose from over 40 settings to optimise code and images.
It was created to offer solutions to the specific problems identified in tools like PageSpeed Insights, so it’s a great place to start. Good luck!





Thank you, the article is amazing! I use Google speed test, it’s good, but I find some interesting alternatives, maybe I’ll try somehow.
This is a fantastic post, I personally only use Google Speed Test and GTMetrix, but it’s good to know other trusted sources.