
Understanding and tracking your SEO metrics is key to optimising your campaigns and maximising your return on investment.
With so many tools and data points available, it’s easy to lose focus, misinterpret results, or get bogged down with vanity metrics that don’t truly drive results.
In this guide, we’ll break down the essential SEO metrics that deserve your attention and share cost-effective strategies for tracking them efficiently.
The SEO Metrics You Can’t Ignore
1. Organic Traffic
The cornerstone, and number 1 deliverable of SEO, if your organic traffic is going up, this generally means that your SEO efforts are having a positive effect.
However, to properly understand organic traffic and get some real insights out of it, you should break down your keywords into the following groups:
- Branded/navigational – Organic traffic which comes from people directly searching for your brand, eg: 20i or My20i login.
- Informational – Research or question-based traffic, which will usually land on blog posts, support pages, or FAQs.
- Transactional – Searches which are explicitly looking to make a purchase, often coming from keywords such as “Buy…” or “Book…”.
Ahrefs free keyword generator allows you to view popular questions which match your keyword, whilst SERanking’s free keyword research tool highlights the most likely search intent behind a keyword. The paid version of each of these tools allows you to group keywords by intent much more comprehensively.
Breaking organic traffic down along these lines gives you great insight into the types of content that is bringing your visitors in.
If the bulk of your organic traffic is informational, but sales are low, then this suggests that most people are using your website to find information, but then not finding a reason to make a purchase.
Meanwhile, if your organic traffic is skyrocketing but it’s all branded, then this suggests that the traffic drive may be coming from elsewhere – although SEO & Brand are more tightly linked now than ever before.
How to Track organic traffic:
Organic traffic is one of the easiest baseline metrics to track. The most popular methods are Google’s own free tools, Google Analytics, and Google Search Console.
Analytics (sometimes known as GA4) provides a mass of information about all aspects of your website, including where the traffic comes from and how it interacts with your website – however the UI can be confusing for new users.
Google Search Console (GSC) meanwhile, uses a simpler interface and focuses purely on traffic from Google search.
Applying filters to break down keywords is easy to do in GSC, however there are limitations on the amount of data which is stored.
Bing also provides it’s own, slightly less functional version of Search Console called Bing Webmaster Tools.
If you’d like to move away from tools owned by the search engines themselves, then Matomo Analytics is a popular alternative. See what our team loved and didn’t love about it in our 4.5 star Matomo review.
2. Click-Through Rate (CTR)
Whilst tracking organic traffic shows you how much traffic you’re getting from search engines, click-through rate (CTR) helps you to figure out if you’re getting as much as you should be.
If you are ranking in position 1 for a keyword but find that your click through rate is still very low, then you’re effectively missing out on traffic which could be yours.
A low click through rate often suggests that something about your search snippet, such as the meta title, description, URL or rich snippets are not resonating with the user, or even downright putting them off.
This can be due to poorly written titles, spelling mistakes, missing information, or even the page targeting the wrong intent (going back to the branded, informational, and navigational groups that I mentioned earlier).
Whilst not a direct ranking factor, some studies have suggested that a higher than expected click through rate can improve rankings, so it’s highly important to audit your CTR and search snippets regularly.
How to track click through rate
This can be done in Google’s core tool suite.
Google Search Console is the best way to track click through rate from Google search, with a simple UI allowing you to trigger CTR % on and off on a page, query, device and country basis.

There are a number of other CTR calculators available where you can manually input data, or you can work the percentage out yourself with a simple sum – (Clicks ÷ Impressions) × 100.
Advanced Web Ranking also have a great free tool which allows you to view expected click through rate based on search intent, categories, SERP features and more.
3. Query Count
Often overlooked, query counting is a great way to get a broad view of how your pages are trending in organic search.
Looking beyond your main target keywords, pages will often rank for many other “adjacent” keywords which are closely topically aligned.
The number of these that you rank for is often a great indicator of page health.
If you find that the number of queries your page is ranking for is on the up, then generally speaking that is a sign that your pages are growing in strength and being selected to show on a more regular basis.
On the other hand, if you find that your query count is progressively dropping – especially in line with Google’s algorithm updates – then that can be a sign of weak pages or a declining reputation.
How to track search queries:
For small websites Google Search Console works well for query counting.
Performance > Search Results > Queries shows you the queries you are receiving impressions for. However, this is limited to only 1000 rows.
For larger websites you will need additional functionality from a third party.
Search Analytics for sheets is a great freemium browser add on which allows you to export up to 25,000 queries into a Google Sheet for free.
With this data you can make regular comparisons between the number of queries you rank for and plot this information over time.
SEO Stack is a paid tool which provides unlimited access to queries, and stores history for 5 years rather than Google’s standard 16 months. SEO Stack founder Daniel Foley-Carter writes extensively on query counting, and is listed as one of our favourite SEO’s.
4. Engagement Rate
For many years “bounce rate” was viewed as a key factor in SEO, but in recent years this has been replaced with the more nuanced “engagement rate”.
From Google’s own support database, an “engaged” session is defined as one which meets any of the following criteria:
- Lasts longer than 10 seconds
- Has a key event
- Has 2 or more screen or page views
Whilst still not 100% accurate, engagement rate provides interesting insights into how people use your content, helping to find which posts and pages perform adequately.
A study from Dataflo found that B2B websites have an average engagement rate of 63%, with B2C slightly higher at 71%.
If you find that yours is much lower than this, then it can be a sign that your content is not serving it’s purpose for those who land on it.
How to track engagement rate:
Engagement rate is a Google Analytics data point, so must be tracked within GA4.
Luckily, it’s one of the easier stats to find, with an entire menu section dedicated to “Engagement” metrics.
In here you can also find information on the average engagement time per user and per session.
It’s worth remembering higher doesn’t necessarily mean better with these stats. For example, if your page is very simple and to the point then a massive engagement time suggests something isn’t quite right either.
Always assess these stats with a careful approach, and on a page-by-page basis. You may also want to consider creating custom analytics events for specific types of engagement you wish to measure, for example hovers or scrolls of a certain depth.
7. Conversion rate
Traffic and engagement are great but is it worth anything if you don’t achieve the end goal of a conversion.
Getting someone to purchase, contact, or sign up is ultimately why most people are doing digital marketing, so it’s highly important to make sure that the traffic you’re bringing in is turning into conversions at a decent rate.
Filter your marketing funnels down by source, including search engines, to see what rate people are converting at.
If your conversion rate is low across the board then the likelihood is that your website is letting you down.
If you find that one channel such as organic or paid traffic converts much lower, then it’s likely that you are targeting the wrong keywords or bringing in the wrong type of audience (again, consider the intent behind the keywords).
How to track conversion rate:
Google Analytics is again the go to tool for this, with conversions now known as “Key Events”.
Anything can be set as a key event in GA4, from micro goals such as “watched video” or “downloaded PDF”, to macro goals such as “Checkout complete” or “Lead form sent”. There are a number of events prebuilt into GA4 which you can set as a key event, however for the more complex ones you may need to set up custom variables and triggers within Google Tag Manager.
For more long-term tracking in tools such as Salesforce, UTM parameters can be used to highlight which leads came from organic traffic.
6. Internal Linking
Whilst not explicitly an end user focused metric, tracking the use of internal links across your content is a crucial part of SEO.
Effective internal linking can provide a boost for your rankings, creating a strong website structure, passing authority effectively, and ensuring that all pages can be found by both users and search engines.
Internal links should be relevant, use helpful anchor text, and follow a natural pattern, rather than being used excessively.
How to track internal links:
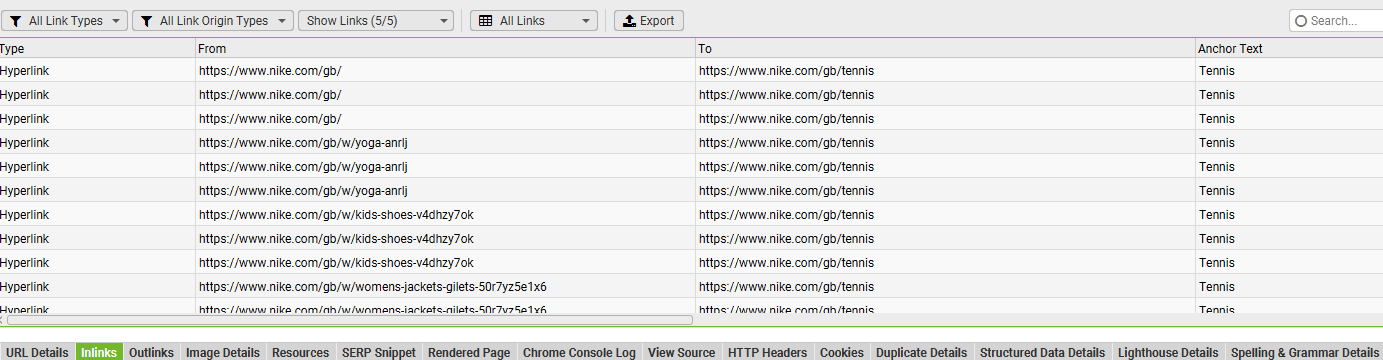
I find Screaming Frog one of the best ways to manage internal links.
The freemium tool offers crawling of up to 500 pages on the free plan, and from here you can then click any page and see all of the internal links pointing into it.
From there you can export all of your data to a spreadsheet and highlight any pages which have very few internal links pointing to them. Screaming Frog also shows anchor text, so you can ensure that you use variety in the ways that you are linking.
Google Search Console also offers insight into internal links, which you can find in Links > Top linked pages – internally.
Here you can view the most internally linked to pages on your website, filter by page, and identify the most or least linked to pages.
For paid tools, all in one SEO suite tools such as Ahrefs offer in depth internal link monitoring tools.
8. Core Web Vitals
Core web vitals (CWV) are Google’s own metrics for measuring the performance of a web page.
Whilst sometimes over-focused on, these are a Google Ranking factor, and therefore an important part of SEO which shouldn’t be ignored.
Not only do CWV’s impact search ranking positions, but if your scores are particularly poor, then this is going to have a noticeable effect on user experience, with visitors likely to leave your website and go elsewhere.
How to track core web vitals:
As this is a Google score, the best way to track you core web vitals are through Google Pagespeed Insights.
This tool will run a quick test and give you scores on each of the metrics which make up the CWVs, as well as general recommendations on how to improve them.
You can also track them in your browser with the inspect tool, then select Lighthouse. Lighthouse technology powers Pagespeed Insights, so scores may be similar, however Lighthouse is “lab” data whilst Pagespeed Insights is closer to real world.
Google Search Console also has a core web vitals section within the “Experience” menu, where you can find a list of your URLs which are considered good, in need of improvement, or poor, along with the reason why.
For more on how to improve your core web vitals, see our guides on largest contentful paint, and cumulative layout shift.
9. Indexation
Often overlooked, indexation metrics are arguably the most important ones on the technical side of SEO.
Indexation is essentially about ensuring your web pages are found, understood, and included in search engine results.
A healthy website should have most of its important pages indexed, with minimal errors or blocking issues.
A dropping indexation count can be a red flag, potentially signalling technical SEO problems or content quality issues.
You can also have to many pages indexed, such as those with parameters or pagination, which can then cause issues with duplicate content, crawl budget, or poor UX.
How to track indexing and crawl stats:
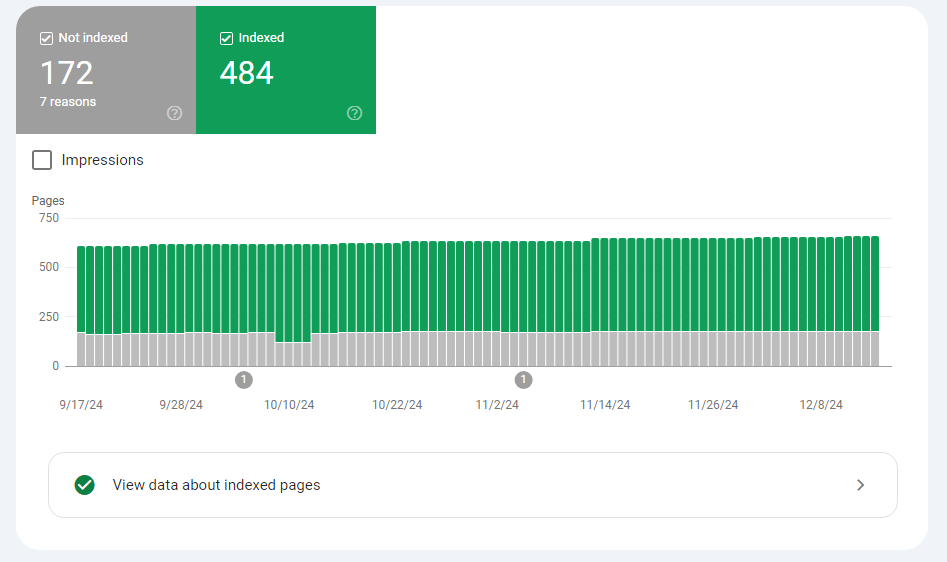
For small websites, Google Search Console works perfectly.
The “Indexing” section gives you an overview of the number of pages you have Indexed and Not Indexed, alongside the most common crawl errors such as 404, Soft 404, 4xx issues, 5xx issues, and duplicate content.
The site: yourdomain.com search operator in Google is another quick way to see how many pages are indexed. This gives you an immediate snapshot of your site’s search visibility.
Consistent issues with crawling and indexation may require you to check your server logs to see exactly which bots are visiting which pages on your website. Tools such as Splunk or Screaming Frog have log file analysis functionality to help digest this information.
Vanity Metrics: What to Ignore
As I mentioned at the start, it’s easy to get overwhelmed and drown in data.
It’s also possible to find yourself reporting on certain metrics which can often paint a false picture of performance.
Here are some of the vanity metrics which you don’t need to be reporting on.
Number of Backlinks
Whilst backlinks are undoubtedly a core part of SEO, focusing on the number of individual backlinks isn’t reliable as one website could link to you 1,000 times, but that doesn’t really hold the power of 1,000 links (if anything that many links from one place could be a negative).
Measuring the quality of the link – relevance, positioning, reputation of the linking site is much more important than a “number of links” report.
If you must measure the number, then focus on referring domains rather than links.
Domain Authority
One of the most misappropriated stats in SEO, so many people track domain authority and hold it up as an example of success or failure.
The truth is domain authority isn’t a thing that Google pays any attention to.
Domain authority is a stat created by SEO tool company Moz to predict a websites ranking potential. From my experience Ahrefs, Semrush, Majestic and most other SEO tools have their own versions of this.
Whilst these scores provide a rough overview of a websites progress (and we now know Google uses their own internal SiteAuthority score), they are not directly tied to SEO performance and can sometimes be out of date or even gamed. The actual number score that you receive is not something you should be spending much time on.
(Some) Search rankings
Calling search rankings a vanity metric in an article about SEO may sound strange, but what I’m talking about here is focusing only on the ranking, and ignoring the actual returns from earning that position.
SEO history is littered with people barking up the wrong tree and chasing rankings which will have no notable effect on wider business goals.
It’s easy to feel like things are going really well because you rank at the top of Google for 50 different terms, but if none of those receive any search volume, or have no relevance to your customer base, then you’re not going to see any benefit from it.
Alternately it’s easy to get caught up in “disaster mode” when you can’t break page 1 for a certain term, but it may well turn out that the traffic you’re chasing isn’t searching for that phrase.
The only keywords worth tracking closely are the ones which are going to have a real positive effect – and they’re often the ones you haven’t even thought of.
Final Thoughts
Monitoring the right SEO metrics is crucial to understanding your website’s performance and ensuring your strategy is efficient and effective. Avoid getting sidetracked by vanity metrics, or tracking too much, and instead prioritise data that aligns with your business goals.
For more on SEO, read on guide on EEAT quick wins to boost SEO.


Add comment